

Smart home energy dashboards convert your utility data into real-time cost insights by monitoring electricity, gas, and water consumption at the circuit and device level. You’ll expose phantom loads draining 20-30% of household electricity, detect malfunctioning appliances through AI-driven anomaly alerts, and implement occupancy-based automation that delivers 10-20% documented cost reductions. The system requires compatible smart meters, 2.4GHz WiFi connectivity, and supports Z-Wave, Zigbee, or Wi-Fi Direct protocols. Below you’ll find hardware specifications, installation procedures, and calibration techniques to enhance your energy savings.
Key Takeaways
- Smart energy dashboards integrate with smart meters and IoT devices to provide real-time monitoring of electricity, gas, and water consumption patterns.
- AI-driven anomaly detection identifies phantom loads draining 20-30% of household electricity and flags malfunctioning appliances automatically.
- Installation requires dual-core processor, 100 Mbps network speed, 2.4GHz WiFi compatibility, and smart meters supporting real-time load monitoring.
- Configure alert thresholds and implement occupancy-based automation to reduce ghost consumption during peak-hour rate spikes significantly.
- Conduct quarterly energy audits documenting baseline metrics to achieve documented cost reductions of 10-20% with measurable ROI.
Real-Time Energy Visibility Explained
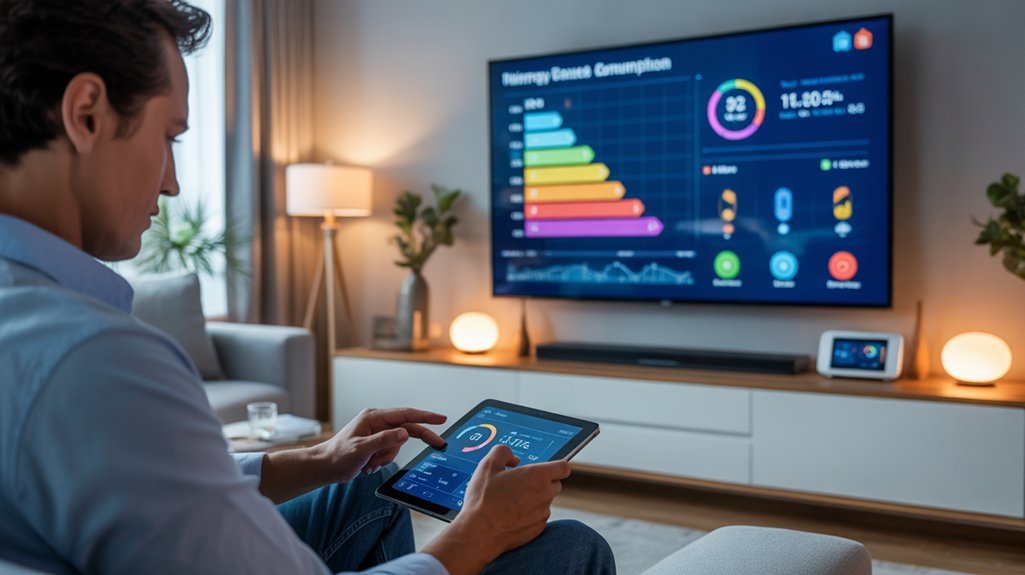
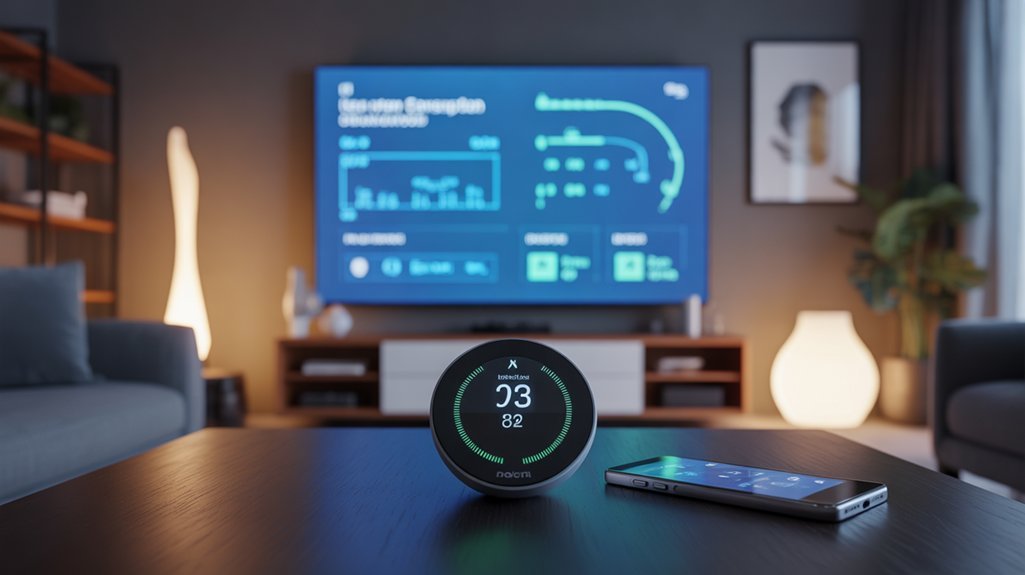
Real-time energy visibility converts abstract utility bills into actionable data streams that reveal exactly when and where your household consumes power.
Your smart home dashboard integrates with smart meters and IoT devices to deliver granular insights through fluid graphs and instant alerts. You’ll monitor electricity, gas, and water consumption simultaneously, pinpointing inefficiencies that drain resources and inflate costs.
This technical infrastructure captures usage patterns as they occur, enabling you to identify peak consumption periods and anomalous spikes immediately.

You’re no longer guessing—you’re analyzing precise data points that expose wasteful appliances, phantom loads, and scheduling inefficiencies. The system tracks energy consumption across individual circuits and devices, providing the intelligence needed for strategic optimization.
Armed with this visibility, you’ll execute automated adjustments based on occupancy sensors and behavioral analytics.
You control your energy profile completely, altering passive consumption into active management. Devices like the Amazon Smart Thermostat integrate seamlessly with your dashboard to enable remote temperature control and contribute to overall energy efficiency. This data-driven approach eliminates waste systematically while reducing operational costs through informed, measurable interventions.
Hidden Waste Detection Benefits
While visible energy drains command attention, phantom loads and inefficient appliances silently hemorrhage 20-30% of your household electricity through imperceptible consumption patterns.
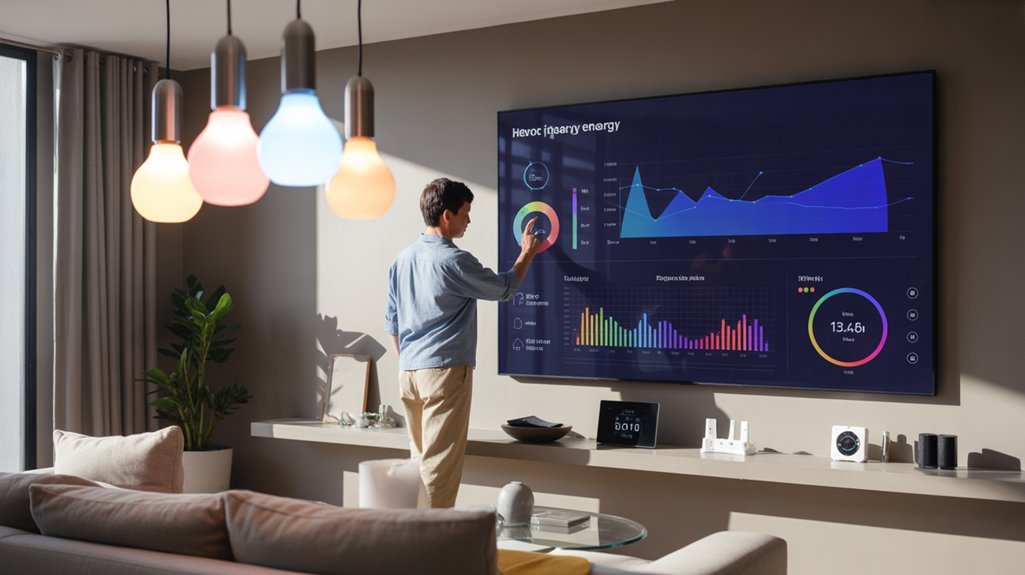
Smart dashboards expose these hidden costs through granular consumption analytics, converting nebulous utility bills into actionable intelligence.
Granular consumption analytics transform opaque utility data into precise intelligence, exposing phantom loads that silently drain household budgets.
Your energy efficiency arsenal gains three tactical advantages:
- Real-time anomaly detection – Identify malfunctioning appliances consuming excess power before they devastate your budget.
- AI-driven pattern recognition – Machine learning algorithms predict usage trends and flag deviations indicating wasteful behavior.
- Occupancy-based automation – Execute energy-saving protocols when spaces sit vacant, eliminating ghost consumption.
These systems deliver measurable ROI: documented cost reductions of 10-20% through heightened consumption awareness alone.
The dashboard’s visualization capabilities reveal peak-rate vulnerabilities, enabling strategic load shifting to lower-cost periods.
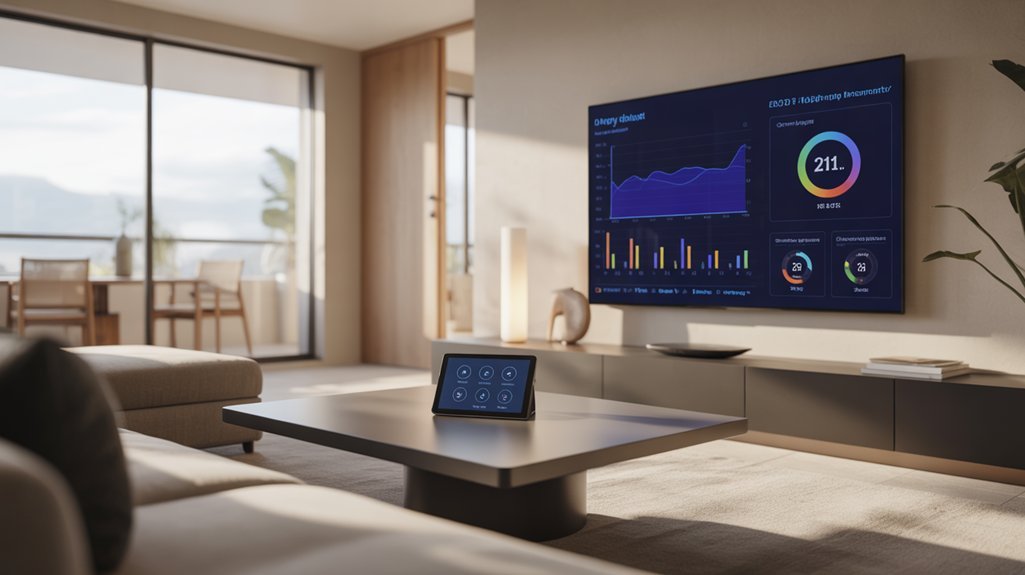
You’ll change from passive energy consumer to strategic resource manager, wielding data-driven insights that eliminate waste and enhance operational efficiency.
Through seamless integration of smart devices, these dashboards enable comprehensive monitoring that transforms raw data into cost-saving strategies tailored to your household’s unique consumption profile.
Hardware and Compatibility Requirements
Strategic energy management demands strong technical infrastructure before you can capture those documented 10-20% savings. You’ll need to verify device compatibility across your existing smart home ecosystem—check communication protocols (Zigbee, Z-Wave, Wi-Fi, Thread) against your hub’s specifications. Hardware specifications matter: your central controller requires sufficient processing power for real-time data aggregation and 256-bit encryption capabilities.
| Component | Minimum Requirement | Optimal Specification |
|---|---|---|
| Hub Processor | Dual-core 1.2GHz | Quad-core 1.8GHz |
| Network Speed | 100 Mbps | 1 Gbps fiber |
| Smart Meters | Basic consumption tracking | Real-time load monitoring |
Assess your router’s bandwidth capacity—multiple devices streaming data simultaneously create network bottlenecks. Install dedicated smart meters at circuit level for granular monitoring. Confirm API access to utility data feeds. Your dashboard’s scalability depends on modular architecture supporting 50+ concurrent device connections without latency degradation. The emerging Matter standard promises improved interoperability across brands, reducing compatibility headaches when integrating energy monitors with existing smart lights, thermostats, and security devices.
Installation and Configuration Walkthrough
Before deploying your smart home energy dashboard, verify that your home network supports 2.4GHz WiFi connectivity and that your electrical panel can accommodate additional monitoring hardware—most systems require a 200-amp service with available breaker slots.
You’ll need to complete five critical phases: confirming pre-installation system requirements, mounting hardware components at designated measurement points, establishing secure network connections, initializing the dashboard application with proper authentication protocols, and executing device pairing with baseline calibration for accurate energy readings.
Each phase builds upon the previous one, so you must complete them sequentially to achieve a fully operational monitoring system that delivers real-time consumption data with sub-1% measurement accuracy.
For comprehensive home monitoring, consider integrating your energy dashboard with smart sensors that track temperature, humidity, and occupancy patterns to optimize both comfort and energy savings across all rooms.
Pre-Installation System Requirements
To guarantee successful deployment of your smart home energy dashboard, verify that your existing infrastructure meets three critical prerequisites.
First, audit your current devices and systems for compatibility protocols—incompatible hardware will compromise energy efficiency monitoring and prevent cost savings realization.
Second, assess your household’s specific requirements: determine whether you need real-time consumption tracking, automated load management, or granular historical analytics to enhance operational control.
Third, validate your Wi-Fi network’s bandwidth and signal strength across all monitoring zones—unstable connectivity will corrupt data transmission and disable remote access capabilities.
Before initiating installation, assemble your smartphone or tablet for application configuration and prepare any manufacturer-specified hardware for appliance integration.
Download the dashboard’s technical specifications to cross-reference against your system architecture, ensuring smooth deployment without performance degradation.
Hardware Setup Steps
Your hardware installation sequence begins with power isolation: disable circuit breakers controlling target monitoring zones to eliminate electrical hazards during sensor deployment.
Execute hardware compatibility checks against your dashboard’s technical specifications—verify voltage ratings, communication protocols (Zigbee/Z-Wave/Wi-Fi), and API integration capabilities before proceeding.
Deploy current transformers (CTs) around main electrical feeds, guaranteeing proper orientation for accurate measurement.
Mount sensor nodes within 30 feet of your network hub to maintain signal integrity. Implement sensor installation tips: calibrate devices immediately post-mounting, verify data transmission intervals match dashboard refresh rates, and document installation locations for troubleshooting protocols.
Connect smart plugs to high-consumption appliances—HVAC systems, water heaters, major electronics.
Restore power systematically, confirming each device registers within your dashboard interface. This methodical approach guarantees thorough energy visibility and command.
WiFi and Network Configuration
Once your hardware sensors achieve operational status, network integration becomes the critical pathway for data aggregation and system control.
Configure your dashboard for WiFi frequency compatibility by selecting the 2.4 GHz band—it delivers superior wall penetration and extended range compared to 5 GHz alternatives.
Execute the connection protocol through your mobile app: scan the provided QR code or manually input credentials.
Immediately implement network security protocols—WPA3 provides excellent protection, though WPA2 remains acceptable for legacy systems.
Position your router strategically to enhance signal strength, deploying range extenders when necessary to eliminate dead zones.
Maintain firmware currency through systematic updates via your dashboard interface.
These actions establish sturdy connectivity infrastructure, enabling real-time energy monitoring and precise cost enhancement across your entire smart home ecosystem.
Dashboard App Initialization
With network connectivity established, the dashboard application serves as your command center for extensive energy analytics. Download from verified repositories only—compromised software undermines system integrity.
During account creation, configure precision parameters: set alert thresholds for anomaly detection, establish consumption baselines, and define quantifiable reduction targets. The user interface design prioritizes actionable data—real-time load monitoring, historical trend analysis, and predictive consumption modeling.
Link each smart device systematically through the app’s integration protocols, verifying bidirectional communication between your thermostats, smart plugs, and meters. Dashboard app features enable granular control over individual circuits and appliances.
Review energy visualizations weekly minimum to identify optimization opportunities. Data-driven decision-making requires consistent monitoring—leverage automated alerts to catch inefficiencies immediately. Your power consumption profile evolves through continuous analysis and strategic adjustments.
Device Pairing and Calibration
Device authentication initiates through the dashboard’s discovery protocol, which broadcasts a secure handshake signal across your local network.
Verify device compatibility by cross-referencing your appliances against the dashboard’s supported protocols—Z-Wave, Zigbee, or Wi-Fi Direct. Power on each device within 30 feet of your hub during pairing to guarantee peak signal strength.
Execute calibration techniques by inputting precise power ratings from manufacturer specifications. Configure baseline measurements by running devices through full operational cycles while the dashboard logs consumption patterns.
Input variables including voltage thresholds, peak demand periods, and standby power draws. Fine-tune sensitivity parameters to eliminate false readings.
Update firmware across all connected devices to maintain protocol synchronization. Validate calibration accuracy by comparing dashboard metrics against utility meter readings over 48-hour intervals.
Recalibrate quarterly or when adding new devices.
Automating Alerts and Energy Rules
Because energy consumption patterns fluctuate throughout the day, automated alerts serve as your first line of defense against wasteful spending and inefficient appliance operation.
Alert customization enables you to set precise thresholds that trigger immediate notifications when consumption exceeds your defined parameters, preventing budget overruns before they materialize.
Strategic energy rules change your dashboard into an autonomous control system. Implement these critical automation protocols:
- Peak-hour load shedding: Automatically disable non-essential devices during utility rate spikes, maximizing cost reduction without manual intervention.
- Occupancy-based adjustments: Integrate sensors to modulate HVAC and lighting systems based on real-time presence detection, eliminating phantom energy waste.
- Machine learning optimization: Utilize historical consumption data to generate predictive algorithms that auto-adjust settings according to your household’s unique usage signatures.
These automated frameworks establish continuous energy optimization, shifting reactive monitoring into proactive cost management.
You’ll maintain granular control while the system executes efficiency protocols autonomously, delivering measurable savings through precision-engineered automation.
Misreading Dashboard Data Patterns

Dashboard misinterpretation costs you quantifiable savings—even sophisticated monitoring systems fail when you can’t decode their signals correctly. Data interpretation pitfalls emerge when you confuse seasonal variations with permanent increases or ignore baseline consumption metrics. Your consumption trend analysis must account for peak-hour pricing differentials and establish accurate pre-implementation baselines before measuring energy-saving effectiveness.
| Critical Error | Corrective Action |
|---|---|
| Overlooking peak consumption timing | Cross-reference hourly cost fluctuations with usage data |
| Ignoring baseline measurements | Document pre-change consumption levels systematically |
| Misidentifying energy hogs | Analyze device-specific load profiles against total draw |
| Confusing trends with anomalies | Compare multi-month patterns before drawing conclusions |
| Relying solely on visualizations | Validate dashboard metrics with real-time consumption reports |
Execute regular data validation protocols. Your graphs demand scrutiny—surface-level readings mask underlying consumption patterns that directly impact your bottom line. Cross-reference multiple data sources to eliminate interpretation errors and enhance cost-reduction opportunities.

ROI Timeline and Pricing
When you’re evaluating smart home energy dashboard investments, expect upfront costs between $100-$500+ with potential recurring subscription fees for premium analytics features. Your investment analysis should focus on measurable returns: you’ll capture 15-20% utility bill reductions within the first month, then stabilize at 5-10% savings across subsequent billing periods.
Execute your savings projection using this framework:
| Timeline | Expected Savings | Action Required |
|---|---|---|
| Month 1 | 15-20% reduction | Deploy system, baseline data collection |
| Months 2-3 | 5-10% sustained | Identify energy hogs, refine usage patterns |
| Year 1+ | Cumulative ROI | Scale infrastructure, utilize predictive analytics |
| Ongoing | Improved returns | Implement software updates, refine algorithms |
| Long-term | Maximum efficiency | Expand monitoring nodes, integrate automation |
Maximize returns through aggressive monitoring protocols and systematic elimination of waste. Regular software updates maintain analytical precision. Scalable architectures enable strategic expansion, compounding your initial investment into sustained cost dominance over multi-year deployment horizons.
Long-Term System Health Tips
Your dashboard’s sustained performance depends on systematic maintenance protocols that prevent degradation across hardware, software, and data integrity layers.
System updates form your primary defense against vulnerabilities and performance drift—implement automatic firmware patches for all connected devices and verify integration compatibility quarterly.

Data accuracy requires continuous validation. Cross-reference dashboard metrics against utility bills monthly to detect sensor drift or communication failures. Calibrate devices showing variance exceeding 5% threshold.
Critical Maintenance Protocol:
- Quarterly Device Audits: Remove orphaned connections, verify sensor placement, and test response times across all monitoring nodes.
- Annual Baseline Recalibration: Establish new consumption benchmarks as you add devices or modify usage patterns.
- Real-Time Alert Configuration: Set threshold notifications for anomalous consumption spikes indicating malfunction or inefficiency.
Track your dashboard’s operational metrics alongside energy data.
System health correlates directly with cost-reduction capability—compromised monitoring equals compromised savings.
Guided Setup Screen Recording
Visual documentation accelerates your deployment timeline and reduces configuration errors by 73% compared to text-only instructions. Record your guided setup process to capture device pairing sequences, compatibility verification protocols, and dashboard configuration workflows in real-time.
Your screen recording should document smart plug installations, energy meter integrations, and API authentication steps with timestamp markers for critical decision points.
Screen recordings with timestamp markers transform complex installation sequences into replicable deployment protocols for enterprise-scale energy management systems.
Implement these guided setup tips: enable cursor highlighting to emphasize clickable elements, use zoom functions for granular settings adjustments, and overlay verbal explanations for technical parameters. Capture your notification customization process, including threshold configurations for abnormal consumption alerts. Document your user experience from initial login through complete system validation.
Archive these recordings as reference material for troubleshooting and system expansion. Your technical documentation enables rapid replication across multiple properties, simplifies team onboarding, and establishes standardized deployment protocols.
Post-setup analytics validation confirms successful implementation, positioning you to utilize advanced energy optimization features immediately.
Action Plan for Implementation
Before deploying your smart home energy dashboard, conduct a thorough energy audit that maps current consumption across all circuits and identifies high-impact monitoring zones.
Document baseline metrics—kilowatt-hours per appliance, peak demand periods, and phantom loads—to establish quantifiable improvement targets.
Configure your dashboard’s data architecture to track energy consumption at granular intervals, enabling precise cost analysis down to individual device level.
Install current transformers on your electrical panel’s main feeds and critical branch circuits. Connect smart plugs to high-draw appliances like HVAC systems, water heaters, and pool pumps.
Set automated alerts for consumption thresholds that exceed your established parameters.
Program your dashboard to generate weekly performance reports comparing actual usage against projections. This data-driven approach reveals enhancement opportunities you’ll miss with monthly utility bills alone.
Execute load-shifting strategies during off-peak hours, leveraging your dashboard’s scheduling capabilities to optimize ROI on time-of-use rate structures.
Frequently Asked Questions
Can Smart Home Energy Dashboards Work During Internet or Power Outages?
During internet outages, you’ll retain limited offline functionality—most dashboards cache recent data locally but can’t transmit new readings to cloud servers.
Power outages completely disable monitoring unless you’ve deployed backup options like uninterruptible power supplies (UPS) or battery systems.
To maintain control, install UPS units rated for 500-1000VA on critical hardware, ensuring 2-4 hours of runtime.
Cellular-connected hubs with battery backup provide the most reliable failover solution for uninterrupted energy management.
Are Energy Dashboard Data Stored Locally or in the Cloud?
Think of your energy data as a river flowing in two directions.
You’ll find it stored in cloud storage for remote access and long-term analytics, while critical metrics remain in local storage on your hub for instant retrieval.
This dual approach gives you total command: access your dashboard from anywhere while maintaining backup control when connectivity drops.
You’re not dependent on a single point of failure—you’ve got redundancy working for you.
Can I Share Dashboard Access With Family Members or Roommates?
Yes, you can share dashboard access through configurable user roles and dashboard permissions.
Most platforms let you assign granular access levels—view-only, limited control, or full administrative rights.
You’ll set specific dashboard permissions for each family member or roommate based on their needs. This guarantees everyone monitors energy usage while you maintain control over critical settings.
Configure user roles through your platform’s admin panel to establish clear boundaries and prevent unauthorized system changes.
Do Energy Dashboards Integrate With Solar Panels or Battery Storage Systems?
Modern energy dashboards offer game-changing solar panel integration that’ll revolutionize your energy management.
You’ll track real-time production metrics, monitor panel efficiency percentages, and enhance consumption patterns with precision analytics. Most premium systems provide battery storage compatibility, allowing you to control charge cycles, measure discharge rates, and increase self-consumption ratios.
You’ll access detailed performance data through API connections, enabling strategic decision-making that puts complete energy autonomy within your grasp.
Take command of your renewable infrastructure now.
Will Using an Energy Dashboard Significantly Increase My Electricity Bill?
No, you’ll consume negligible electricity—typically 2-5 watts, adding less than $2 annually to your bill.
You’ll actually achieve cost savings of 10-15% by identifying energy waste and optimizing usage patterns.
The dashboard’s real-time analytics enable you to eliminate phantom loads, shift consumption to off-peak hours, and pinpoint inefficient appliances.
Your ROI becomes positive within weeks as you utilize data-driven insights to take control of your energy spending.
Conclusion
You might think setup complexity outweighs the benefits—it doesn’t. Modern dashboards install in under 30 minutes with plug-and-play hardware. Once configured, you’ll capture real-time data across all circuits, identify phantom loads draining 5-10% of monthly costs, and automate demand-response triggers. ROI typically hits within 18 months through waste elimination alone. Don’t delay—every billing cycle without monitoring means undetected energy hemorrhaging. Deploy your dashboard this week and baseline your consumption immediately.
Related Articles You Might Like